
Cynthia Dunlop has been writing about software development and testing for much longer than she cares to admit. She’s currently senior director of content strategy at ScyllaDB.
Read more from Cynthia Dunlop

Agoda is the Singapore wing of Booking Holdings, the world’s leading provider of online travel (the brand behind Booking.com, Kayak, Priceline, etc.). From January 2023 to February 2025, Agoda server traffic spiked by 50 times. That’s fantastic business growth, but also the trigger for an interesting engineering challenge.
Specifically, the team had to determine how to scale their ScyllaDB-backed online feature store to maintain 10ms P99 latencies despite this growth. Complicating the situation, traffic was highly bursty, cache hit rates were unpredictable and cold-cache scenarios could flood the database with duplicate read requests in a matter of seconds.
At Monster Scale Summit 2025, Worakarn Isaratham, lead software engineer at Agoda, shared how they tackled the challenge. You can watch his entire talk or read the highlights below.
Note: Monster Scale Summit is a free, virtual conference on extreme-scale engineering with a focus on data-intensive applications. Learn from luminaries like antirez, creator of Redis; Camille Fournier, author of “The Manager’s Path” and “Platform Engineering”; Martin Kleppmann, author of “Designing Data-Intensive Applications” and more than 50 others, including engineers from Discord, Disney, Pinterest, Rivian, Datadog, LinkedIn, and Uber Eats. Register and join us March 11-12 for some lively chats.
Agoda operates an in-house feature store that supports both offline model training and online inference.
For anyone not familiar with feature stores, Isaratham provided a quick primer. A feature store is a centralized repository designed for managing and serving machine learning features. In the context of machine learning, a feature is a measurable property or characteristic of a data point used as input to models. The feature store helps manage features across the entire machine learning pipeline — from data ingestion to model training to inference.
Feature stores are integral to Agoda’s business.
Isaratham explained: “We’re a digital travel platform, and some use cases are directly tied to our product. For example, we try to predict what users want to see, which hotels to recommend and what promotions to serve. On the more technical side, we use it for things like bot detection. The model uses traffic patterns to predict whether a user is a bot, and if so, we can block or deprioritize requests. So the feature store is essential for both product and engineering at Agoda. We’ve got tools to help create feature ingestion pipelines, model training, and the focus here: online feature serving.”
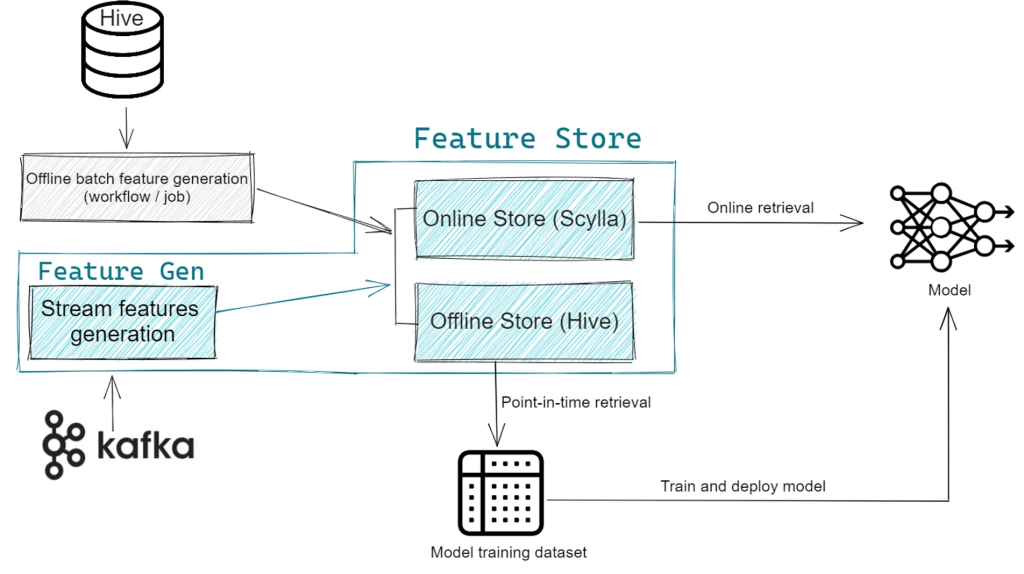
One layer deeper into how it works:
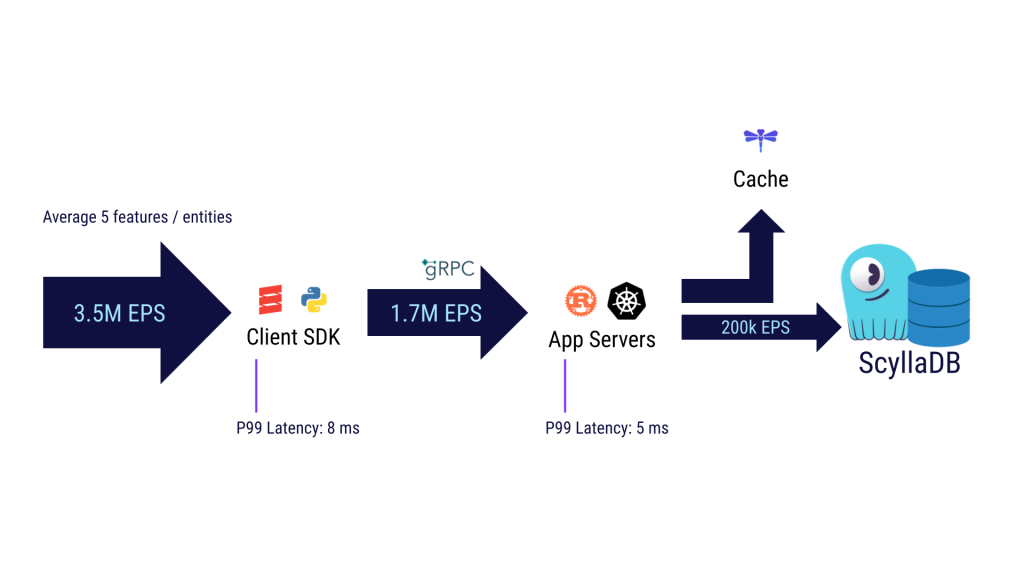
“We’re currently serving about 3.5 million entities per second (EPS) to our users. About half the features are served from cache within the client SDK, which we provide in Scala and Python. That means 1.7 million entities per second reach our application servers. These are written in Rust, running in our internal Kubernetes pods in our private cloud. From the app servers, we first check if features exist in the cache. We use DragonflyDB as a non-persistent centralized cache. If it’s not in the cache, then we go to ScyllaDB, our source of truth.”
ScyllaDB is a high-performance database for workloads that require ultra-low latency at scale. Agoda’s current ScyllaDB cluster is deployed as six bare-metal nodes, replicated across four data centers. Under steady-state conditions, ScyllaDB serves about 200K entities per second across all data centers while meeting a service-level agreement (SLA) of 10ms P99 latency. (In practice, their latencies are typically even lower than their SLA requires.)
However, it wasn’t always that smooth and steady. Around mid-2023, they hit a major capacity problem when a new user wanted to onboard to the Agoda feature store. Their traffic pattern was super bursty: It was normally low, but occasionally it would flood them with requests triggered by external signals. These were cold-cache scenarios, where the cache couldn’t help. Isaratham shared, “Bursts reached 120K EPS, which was 12 times the normal load back then.”
rRequest duplication exacerbated the situation. Many identical requests arrived in quick succession. Instead of one request populating the cache and subsequent requests benefiting, all of them hit ScyllaDB at the same time — a classic cache stampede. They also retried failed requests until they succeeded — and that kept the pressure high.
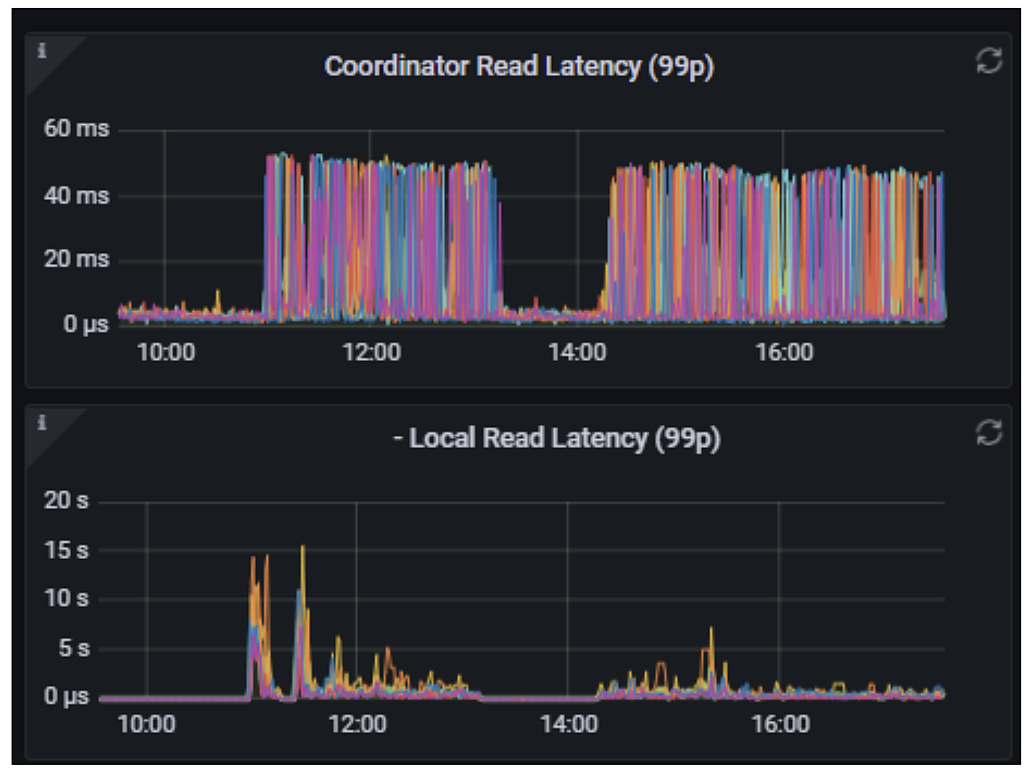
This load involved two data centers. One slowed down but remained online. The other was effectively taken out of service. More details from Worakarn: “On the bad DC, error rates were high and retries took 40 minutes to clear; on the good one, it only took a few minutes. Metrics showed that ScyllaDB read latency spiked into seconds instead of milliseconds.”
So, they compared setups and found the difference: the problematic data center used SATA SSDs while the better one used NVMe SSDs. SATA (serial advanced technology attachment) was already old tech, even then. The team’s speed tests suggested that replacing the disks would yield a 10X read performance boost — and better write rates too.
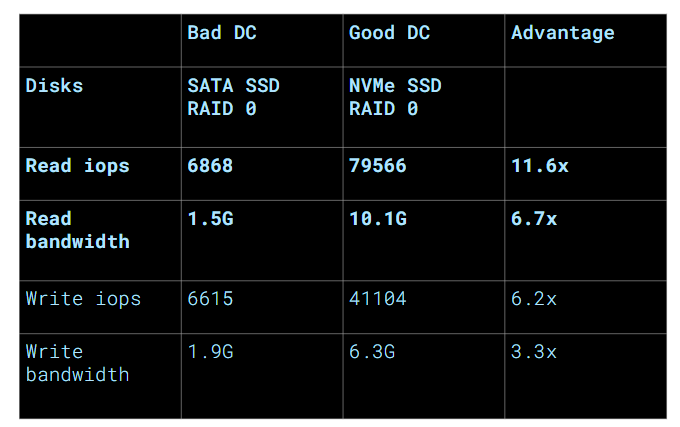
The team ordered new disks immediately. However, given that the disks wouldn’t arrive for months, they had to figure out a survival strategy until then.
As Isaratham shared, “Capacity tests and projections showed that we would hit limits within eight or nine months even without new load — and sooner with it. So, we worked with users to add more aggressive client-side caching, remove unnecessary requests and smooth out bursts. That reduced the new load from 120K to 7K EPS. That was enough to keep things stable, but we were still close to the limit.”
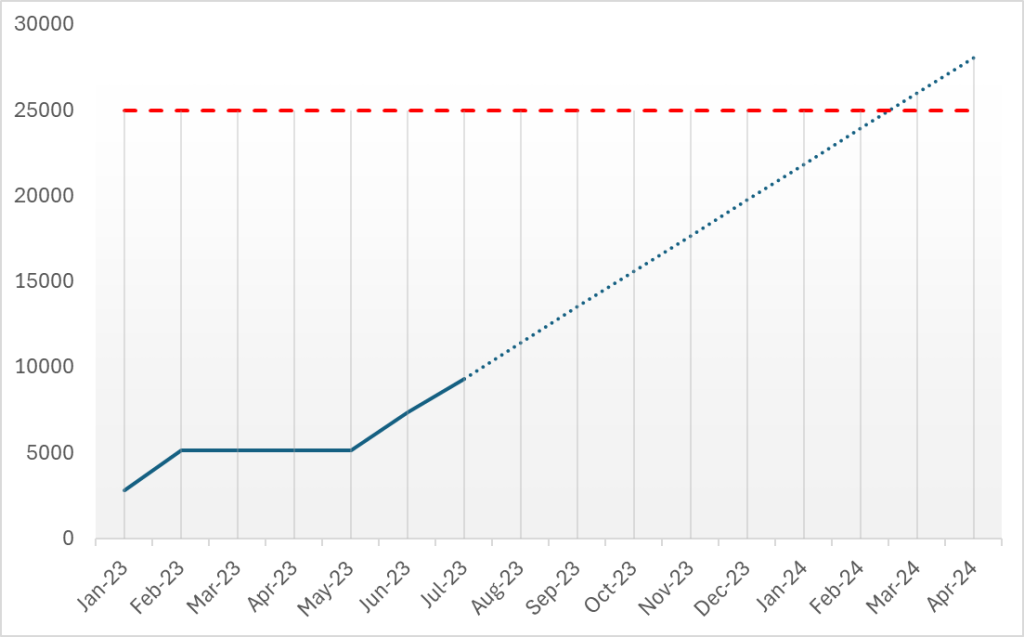
Given the imminent capacity cap, the team brainstormed ways to improve the situation while still on the existing SATA disks. Since you have to measure before you can improve, getting a clean baseline was the first order of business.
“The earlier capacity numbers were from real-world traffic, which included caching effects,” Isaratham detailed. “We wanted to measure cold-cache performance directly. So, we created artificial load using one-time-use test entities, bypassed cache in queries and flushed caches before and after each run. The baseline read capacity on the bad DC was 5K EPS.”
With that baseline set, the team considered a few different approaches.
All features from all feature sets were stored in a single table. The team hoped that splitting tables by feature set might improve locality and reduce read amplification. It didn’t. They were already partitioning by feature set and entity, so the logical reorganization didn’t change the physical layout.
Given a read-heavy workload with frequent updates, ScyllaDB documentation recommends the size-tiered compaction strategy to avoid write amplification. But the team was most concerned about read latency, so they took a different path.
According to Worakarn: “We tried leveled compaction to reduce the number of SSTables per read. Tests showed fetching 1KB of data required reading 70KB from disk, so minimizing SSTable reads was key. Switching to leveled compaction improved throughput by about 50%.”
ScyllaDB uses summary files to more efficiently navigate index files. Their size is controlled by the sstable_summary_ratio setting. Increasing the ratio increases the summary file size, reducing index reads at the cost of additional memory. The team increased the ratio by 20 times, which boosted capacity to 20K EPS. This yielded a nice 4X improvement, so they rolled it out immediately.
Finally, the NVMe disks arrived a few months later. This one change made a massive difference. Capacity jumped to 300K EPS, a staggering 50-60X improvement.
The team rolled out improvements in stages: first, the summary ratio tweak (for 2-3X breathing room), then the NVMe upgrade (for 50X capacity). They didn’t apply leveled compaction in production because it only affects new tables and would require migration. Anyway, NVMe already solved the problem.
After that, the team shifted focus to other areas: improving caching, rewriting the application in Rust and adding cache stampede prevention to reduce the load on ScyllaDB. They still revisit ScyllaDB occasionally for experiments. A couple of examples:
Isaratham wrapped it up as follows:
“We’d been using ScyllaDB for years without realizing its full potential, mainly because we hadn’t set it up correctly. After upgrading disks, benchmarking and tuning data models, we finally reached proper usage. Getting the basics right — fast storage, knowing capacity, and matching data models to workload — made all the difference. That’s how ScyllaDB helped us achieve 50X scaling.”
YOUTUBE.COM/THENEWSTACK
Tech moves fast, don’t miss an episode. Subscribe to our YouTube
channel to stream all our podcasts, interviews, demos, and more.
Source: thenewstack.io…